Tuesday, July 28, 2009

Contrast Calculator


Written in Java, the partially automated contrast calculator aims to simplify the process of finding the high and low values needed to calculate contrast. It runs faster than the IMAQ Vision Builder program because it is dedicated to one purpose and therefore does not have all of the overhead like the other program.

It places the histogram, data output, and image selection all on one screen so multiple readings can be taken more rapidly. The histogram has also been improved by making it larger and easier to read with a zoom function which expands the x-axis. It also includes a feature which allows the user to enter high and low values into two different forms to computer Michelson contrast for both monochrome and color screens. Currently the program only supports JPEG image files, but a less stable, experimental version also supports TIFFs. There is almost no variation between the outputs using the two different image files. The problem with loading TIFFs is the immense amount of memory required to load the image. JPEGs require approximately 56 MB of memory while TIFFs require anywhere from 300-700 MB of memory. To circumvent some of the overhead, the program currently loads a JPEG into the display and allows the user to select the area of the image to be measured, and once the selection has been made, it takes the measurements from a TIFF version of the image. This method runs faster, but not as fast as using just the JPEG. Another problem with this is the file must be available in both TIFF and JPEG for the program to read, so the .CR2 files must be converted into both and held within the same folder.

Friday, July 10, 2009

Finding Light Values in Color Screens

For monochrome screens, the light and dark peaks are both distinct single peaks making it easy to choose a point as the light and dark values for Michelson contrast. The dark peak in colored screens is usually easy to find, but the light peak is at best a triplet of peaks, and at worst an amorphous blob that is a combination of all three peaks on top of one another such as in the following image:

To solve this problem, we added a filter to single out the individual red, green, and blue peaks. For example, to find the red peaks in the image, the program simply eliminates all RGB values in which red is not the largest value.

This results in a much cleaner looking graph which contains more useful information than the combined histogram. From this we extract the high peaks of the red, green, and blue values and enter them into the formula (0.2126*red + 0.7152*green + 0.0722*blue) to find the luminance of the light peak for the screen. Now that both the light and dark peaks of the color screen have been calculated, we calculate Michelson contrast using the same method as with monochrome screens. We would like to find a way to implement an algorithm that finds the average of each peak instead of just finding the absolute maximum value.

Saturday, June 27, 2009

American Association of Physicists in Medicine (AAPM) Task Group 18

The American Association of Physicists in Medicine (AAPM) Task Group 18 is a national task force consisting of medical imaging experts and organizational affiliates dealing with performance evaluation of electronic display devices. The purpose of the Task Group is to generate a document that provides guidelines to practicing medical physicists and engineers for in-field performance evaluation of electronic display devices intended for medical use. Some of the goals of the Task Group include:
  1. Standardization: providing standard testing methods for evaluating the performance of electronic display devices utilized in medicine, allowing inter- and intra-institutional comparisons
  2. Establishing performance criteria: recommending minimum performance requirements for safe utilization of electronic displays in medical and radiologic applications
  3. Education: educating medical physicists and other health-care professionals about display technology and display quality issues relevant to medical imaging
  4. Communication: facilitating communication between industry, medical physicists, researchers, and other individuals/organizations dealing with display quality characterization
  5. Professional: further expanding the role of medical physics in the growing area of PACS


The AAPM TG18's excellent report and valuable guide on the "Assessment of Display Performance for Medical Imaging Systems" can be found here (PDF, 12MB).

Further information about the AAPM TG18, links to downloadable test patterns and other valuable links can be found here.

Friday, June 12, 2009

Tuesday, October 14, 2008

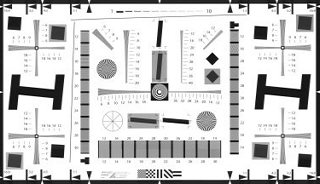
1951 USAF Contrast Resolution Target

From Edmund Optics...
"Since imaging systems are often classified in terms of resolution and contrast, our photographic paper targets allow users to evaluate their systems using the standard USAF format for resolution measurements at different contrast levels... By imaging targets of various contrast, the user can make qualitative comparisons between lenses as well as evaluate the performance of the system for objects with varying or low contrast levels."


The 1951 USAF Contrast Resolution Target, comprised of 15 patterns identical to the picture above at different levels of contrast, will be used to calibrate the optics lab in regards to contrast and spatial frequency.


more...

Font Measurements

An Edmund Optics 35mm Contact Reticle (link) has been outfitted to the optics lab in order to take accurate font measurements.


The reticle, positioned directly against against the integrating sphere, is capable of measuring fonts up to 35mm in size with a very high degree of precision. The markings on the reticle are low reflection and high contrast, allowing for easy readability. The physical setup of the optics lab will allow for the display to be flush against the reticle, providing optimum focus and accuracy in the measurements.

Wednesday, June 25, 2008

Marshall University students participate in breakthrough developments at AFB TECH Optic Lab

MEDIA ADVISORY FROM MARSHALL UNIVERSITY COMMUNICATIONS
ONE JOHN MARSHALL DRIVE, HUNTINGTON, WV 25755


FOR IMMEDIATE RELEASE
Monday, June 23, 2008
Contact: Lee Huffman, AFB TECH, (304) 523-8651, and/or Lalena Price, Marshall University Communications, (304) 746-1989

Marshall University students participate
in breakthrough developments at AFB TECH Optic Lab

Technology demonstration to take place on Wednesday

HUNTINGTON, W.Va. – Imagine not being able to read the small screens found on everything from cell phones to iPods or microwaves to life-saving diabetes equipment. Unfortunately, that is the reality for 20 million Americans who say they have trouble seeing even with the aid of glasses or contact lenses.

On Wednesday, June 25, the American Foundation for the Blind Technology and Employment Center (AFB TECH), with the help of Marshall University students and professors, will unveil a new device designed to measure contrast of digital displays.

The device, developed by Marshall University physicist Dr. Thomas Wilson and engineered by faculty and students of the Marshall University College of Information Technology and Engineering in conjunction with AFB TECH, is the first step in determining the level of contrast necessary to make digital displays usable by people with vision loss. At the event, AFB TECH and Marshall University staff will demonstrate how this technology works.

“With the U.S. population aging and the vision loss numbers expected to increase substantially, more and more people will need technology to be accessible,” said Mark Uslan, director of AFB TECH. “We hope this project will ultimately lead to manufacturing standards that ensure small screen displays are readable for everyone.”

Marshall University professor Joe Fuller said the goal of the AFB project is to ensure that people with vision loss can fully participate in our increasingly digital world. He said it was an exciting project for the computer science students that participated.

“I am very grateful to Mark Uslan and AFB for giving our students the opportunity to work in a real-world environment,” Fuller said. “It was also gratifying to see how well they performed.”


WHAT: Technology demonstration
WHEN: 10 a.m. Wednesday, June 25
WHERE: AFB TECH Optics Lab
949 3rd Ave., Suite 200, Huntington, W.Va.
WHO: Lee Huffman, National Technology Associate, AFB TECH
Jack Smith, Ph.D., CEGAS (Center for Environmental, Geotechnical and Applied Science)
Thomas Wilson, Ph.D., Marshall University physicist and project developer
Joe Fuller, Marshall University Computer Science professor
Russell Farmer, junior, Weisberg Division of Engineering & Computer Science Department at Marshall University
Jacob Bills, sophomore, Weisberg Division of Engineering & Computer Science Department at Marshall University
Steven Taylor, Marshall University Yeager Scholar

Monday, June 23, 2008

AAPM-TG18: Assessment of Display Performance for Medical Imaging Systems

The American Association of Physicists in Medicine (AAPM) Task Group 18 is a national task force consisting of medical imaging experts and organizational affiliates dealing with performance evaluation of electronic display devices. The purpose of the Task Group is to generate a document that provides guidelines to practicing medical physicists and engineers for in-field performance evaluation of electronic display devices intended for medical use.
more...

Download the full AAPM-TG18 report (PDF), or the Executive summary (PDF).

Sunday, June 22, 2008

Sample results

Here are some sample results from the re-engineered system.

The following is a histogram plot in IMAQ Vision Builder showing high and low luminance profiles used in a Michelson Contrast measure.


The following is an edge profile and an SFR (MTF) plot from Imatest.


The following is an SQF chart from Imatest.

Re-engineered system

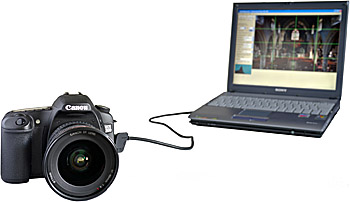
The re-engineered contrast measurement system for passive LCD displays is now operational. The optics equipment comprises a Canon EOS 40D DSLR camera, a Canon EF 100mm f/2.8 Macro USM lens, a set of Kenko extension tubes, a Newport iris diaphragm, and a SphereOptics integrating sphere housing a fan-cooled 4-watt 12v lamp powered by an Agilent E3634A power supply. The mechanical hardware includes a vibration-free optics table, rails, posts, post holders, and various positional stages to hold and align the optics equipment and the target LCD device. The software comprises DSLR Remote Pro from Breeze Systems, IMAQ Vision Builder from National Instruments, and Imatest Studio running on a laptop computer connected to the camera via USB and the power supply via USB/RS-232.

Monday, June 9, 2008

Vision Assistant

From National Instruments...
Vision Assistant is an interactive prototyping and 'what-if' environment for prototyping vision applications. Vision Assistant allows you to learn easily image processing and investigate vision software strategies without programming. Unlike any other interactive vision development tool, Vision Assistant generates a text description - a recipe of the machine vision and image processing functions that provides a guide for developing applications with IMAQ Vision in LabVIEW, BridgeVIEW, LabWindows/CVI, and Component Works with Microsoft Visual Basic and Visual C.

more...

Vision Assistant (IMAQ Vision Builder) has been selected to perform certain image analyses (e.g., line profiles for luminance) for the LCD MTF measurement system.

SQRI Image Quality Metric as a Measure to Predict Character Recognition for Small Visual Displays

By Ronald A. Schuchard, Ph.D., Director, Rehabilitation R&D Center of Excellence, Associate Professor, Emory University School of Medicine
The prevalence of small, often low contrast, visual displays in our society is increasing at a large rate. Some examples of devices that employ small visual displays include cellular phones, personal digital assistants (PDA), home blood pressure monitors (HBPM) and glucometers. These devices, many of which employ low-cost reflective liquid crystal displays, can obviously pose a strong text-recognition challenge for the person with vision loss. The greatest cause of vision loss in the US is macular diseases (including age-related macular degeneration and diabetic retinopathy). In particular, people with macular diseases commonly have central scotomas and/or reduced contrast sensitivity. People with central scotomas (80% of all people with low vision) have functional problems because of the “hole” in the middle of their visual field (caused by central scotomas, also named; central visual field loss; CFL) which leads to problems of reduced visual function associated with the eccentric preferred retinal locus (PRL). As the fine resolution of the human eye is designed to be used on the central visual axis at the fovea, reduced visual acuity and contrast sensitivity is associated with the use of these eccentric PRLs. However, even the fovea can have impaired visual acuity and contrast sensitivity when macular diseases such as diabetic retinopathy impact the fovea.

The goal of this research effort is to investigate the relationship between successful recognition of a single digit / character presented by a small visual display as a function of the contrast ability of a person with vision loss (specifically contrast sensitivity vision loss) using a small visual display and a corresponding image quality metric. The latter will be computed from measurable optical properties of a home blood pressure monitor display, and the contrast sensitivity function of the person with vision loss.

Standard clinical tests will be performed of near visual acuity, letter contrast sensitivity, central visual field loss including mapping the boundaries of central scotomas, and reading performance. Standard research testing will be performed for determining the contrast sensitivity function (threshold contrast ability to detect gratings of different frequencies), dominant eye for perception, and threshold contrast ability to correctly identify characters / digits on a visual display.

The comparison of the contrast characteristics of the visual display with the contrast detection ability of the person is computed to determine a special metric called the Barten SQRI. This Barten SQRI will be compared to the person’s threshold contrast ability to correctly identify the digits on the visual display to determine whether the Barten SQRI can be used to predict the ability of people with low vision to accurately use small visual displays. If this metric accurately predicts performance then vision rehabilitation specialists and visual display manufacturers can use this metric to help people with central visual function loss.

Tuesday, June 3, 2008

Sekonic PRODIGI COLOR C-500

The new Sekonic PRODIGI COLOR C-500 and C-500R is the world's only photographic color meter designed to read spectral sensitivity of both color film and CCD and CMOS sensors used in modern digital still and DV cine cameras.

Serious photographers and cinematographers know that good lighting and proper exposure are more important now than ever. With the higher demands of today's digital medium, 'garbage in' can mean hours of postproduction. They know that color is a critical factor when multiple light sources are involved. Changing reflectors, adding diffusion or adjusting power levels will result in a color temperature change that needs to be corrected. They know that taking the time to do it right is always a good investment because 'perfect in' always looks better than an image that has been adjusted.


more...

This is the color meter chosen for the LCD MTF measurement system to set the color temperature (white balance) on the EOS 40D camera. Here is the product brochure (PDF).

Sunday, May 18, 2008

SQF

From Imatest...
SQF (Subjective Quality Factor) is a measurement of perceived print sharpness that has been used for years in the photographic industry but has remained unfamiliar to most photographers. It includes the effects of
  • MTF: the imaging system's Modulation Transfer Function, which is synonymous with Spatial Frequency Response (SFR),
  • CSF: the human eye's Contrast Sensitivity Function,
  • print height, and
  • viewing distance.
SQF was introduced in the paper, 'An optical merit function (SQF), which correlates with subjective image judgments ,' by E. M. (Ed) Granger and K. N. Cupery of Eastman Kodak, published in Photographic Science and Engineering, Vol. 16, no. 3, May-June 1973, pp. 221-230.
more...

See Also: MTF and SQF at Bob Atkins Photography page.

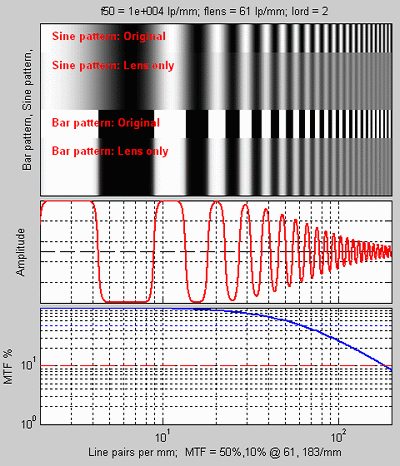
Understanding resolution and MTF

From Norman Koren Photography Page...
The sharpness of a photographic imaging system or of a component of the system (lens, film, image sensor, scanner, enlarging lens, etc.) is characterized by a parameter called Modulation Transfer Function (MTF), also known as spatial frequency response. We present a unique visual explanation of MTF and how it relates to image quality.

more...
See also: Image Sharpness at Imatest.

Using Rescharts

From Imatest...
Imatest™ Rescharts analyzes images of several test charts for resolution-related parameters such as sharpness (i.e., spatial frequency response; MTF), color moir, and fine detail lost to software noise reduction, using a highly interactive user interface...

more...

See also: Testing lenses

Imatest - image quality evaluation software

Imatest™ is the digital imaging industry's leading software package for measuring key image quality factors using inexpensive, widely-available targets.

...Measure device sharpness (MTF), perceptual sharpness (SQF), color response, noise, dynamic range, tonal response, lens flare (veiling glare), lens distortion, lens vignetting, sensor nonuniformity, and color moir with SFR, Colorcheck, Multicharts, Stepchart, Distortion, Light Falloff (Uniformity), and Rescharts.
more...

Here are the Imatest Results for the Canon EOS 40D.


[Use link above if images don't appear]

Understanding Sharpness (MTF) charts.

Imatest has been selected to perform certain contrast analysis (such as MTF and SQF) for the LCD MTF measurement system.

Monday, May 12, 2008

DSLR Remote Pro

DSLR The professional's software solution for remotely controlling your Canon EOS digital SLR from a PC using a FireWire or USB cable.


More...

The camera control and image capture software chosen for the LCD MTF measurement system. Features "Remove Live View" display on a PC.

Canon EF 100mm f/2.8 Macro USM

Autofocus lens for macro photography up to life-size (1x) magnification. Inner focusing affords a long working distance of 5.9in. (149mm) at 1x. A 3-group floating system results in excellent delineation at all focusing distances. Ring USM for silent and high-speed AF, and full-time manual focusing also provided.


More...

This is a macro lens chosen to replace the Zeica Z90 APO microscope zoom lens in the LCD MTF measurement system.Here are the specs.

A set of Kenko extension tubes have also be added to help increase the magnification and/or adjust the working distance of the macro lens.

Canon EOS 40D Digital SLR

The EOS 40D combines Canon's tremendous know-how in both the digital and photographic worlds, creating a camera that not only does everything one would expect of a traditional digital SLR, but one that incorporates staggering leaps forward in technological innovation. With new features like Canon's EOS Integrated Cleaning System, Live View Function, a more powerful DIGIC III Image Processor, plus a 10.1-megapixel CMOS sensor, a 3.0-inch LCD monitor and more, the EOS 40D elevates digital photography to new heights, enhancing the shooting experience, and delivering images one could only expect from a Canon.


more...

This is the camera chosen to replace the existing Canon EOS D30 in the LCD MTF measurement system. Here are the specs.

Here is a very extensive review of the Canon EOS 40D at Imaging Resource.